Cell Image Identifier
A graduate student was doing a project that necessitated identification of individual cells and their nuclei in microscope fluorescence images and quantification of image characteristics within the cell/nuclei areas. With hundreds of cells per image, tens to hundreds of image layers per 3D exposure, and many exposures for the entire experiment, the process of manually tracing each cell and nucleus area in each image using the ImageJ analysis software was incredibly time consuming. Our group worked closely with the lab to develop a program that would automatically identify, outline, and number the cell and nucleus areas, as well as perform the desired analysis, saving the lab countless hours of work.
Key Benefits to the Lab
- Huge time savings compared to manually analyzing all images
- An iterative development process created features the lab couldn’t even imagine at the beginning of the project
- Advanced analysis enabled calculations that would not be possible with existing software
Details
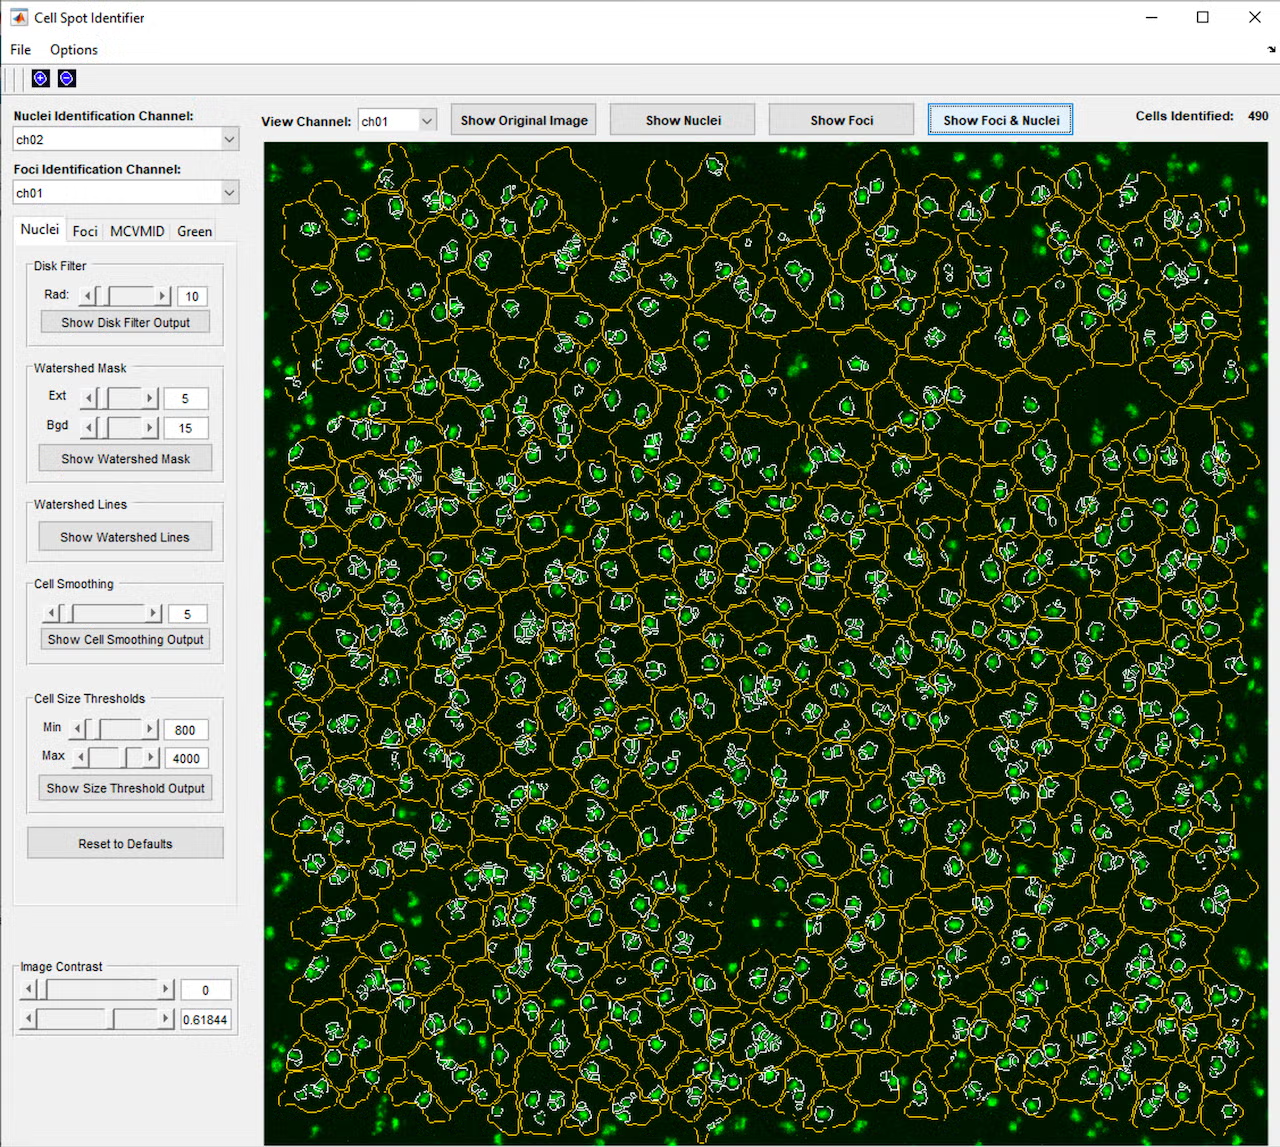
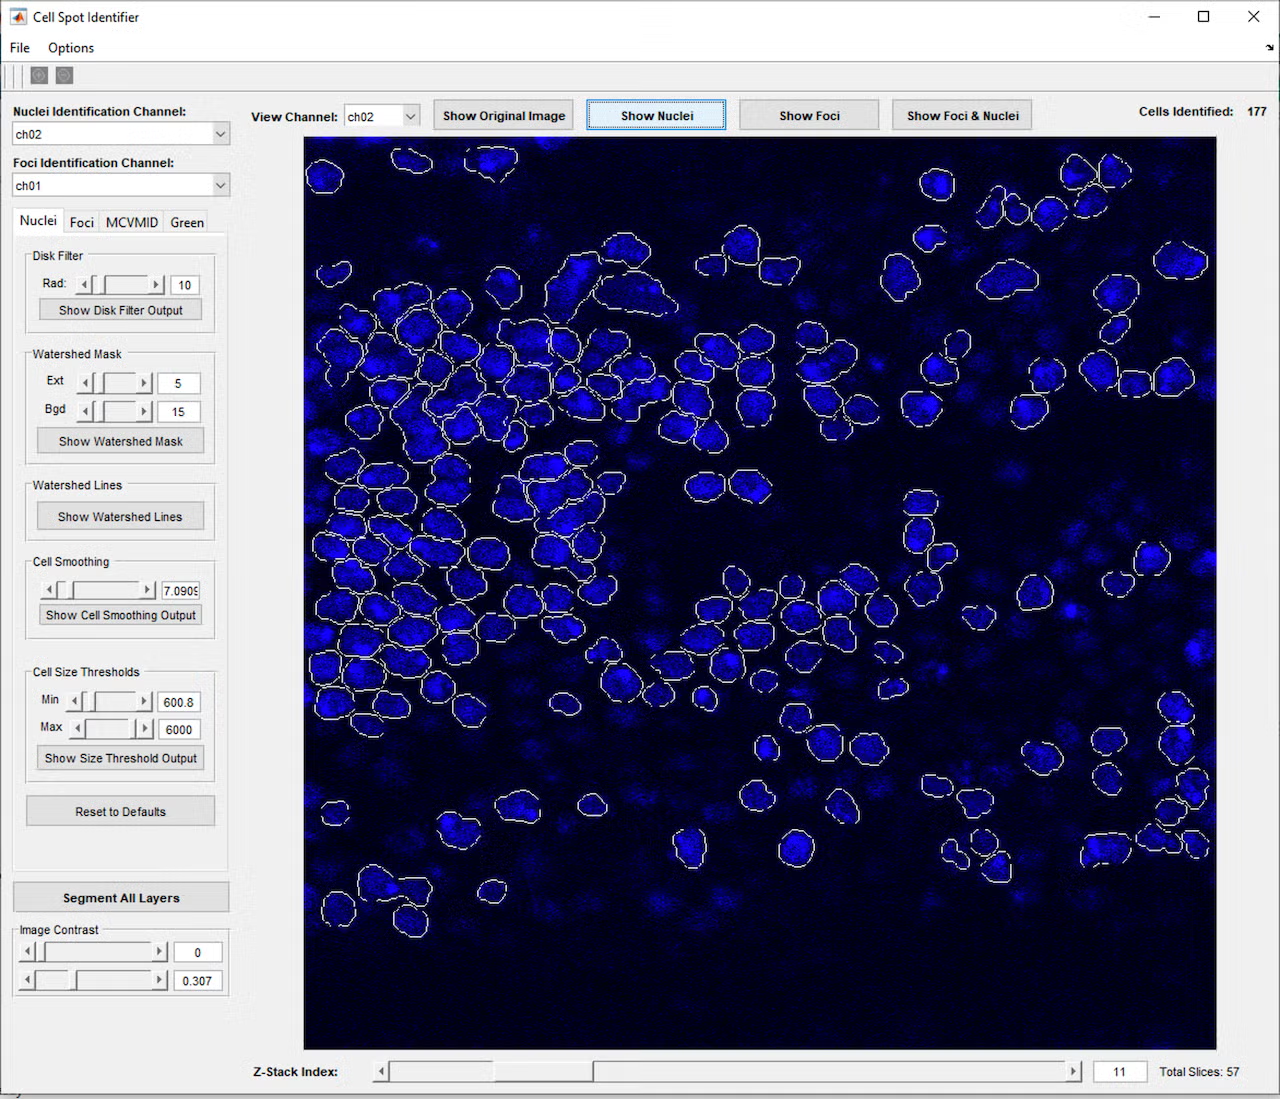
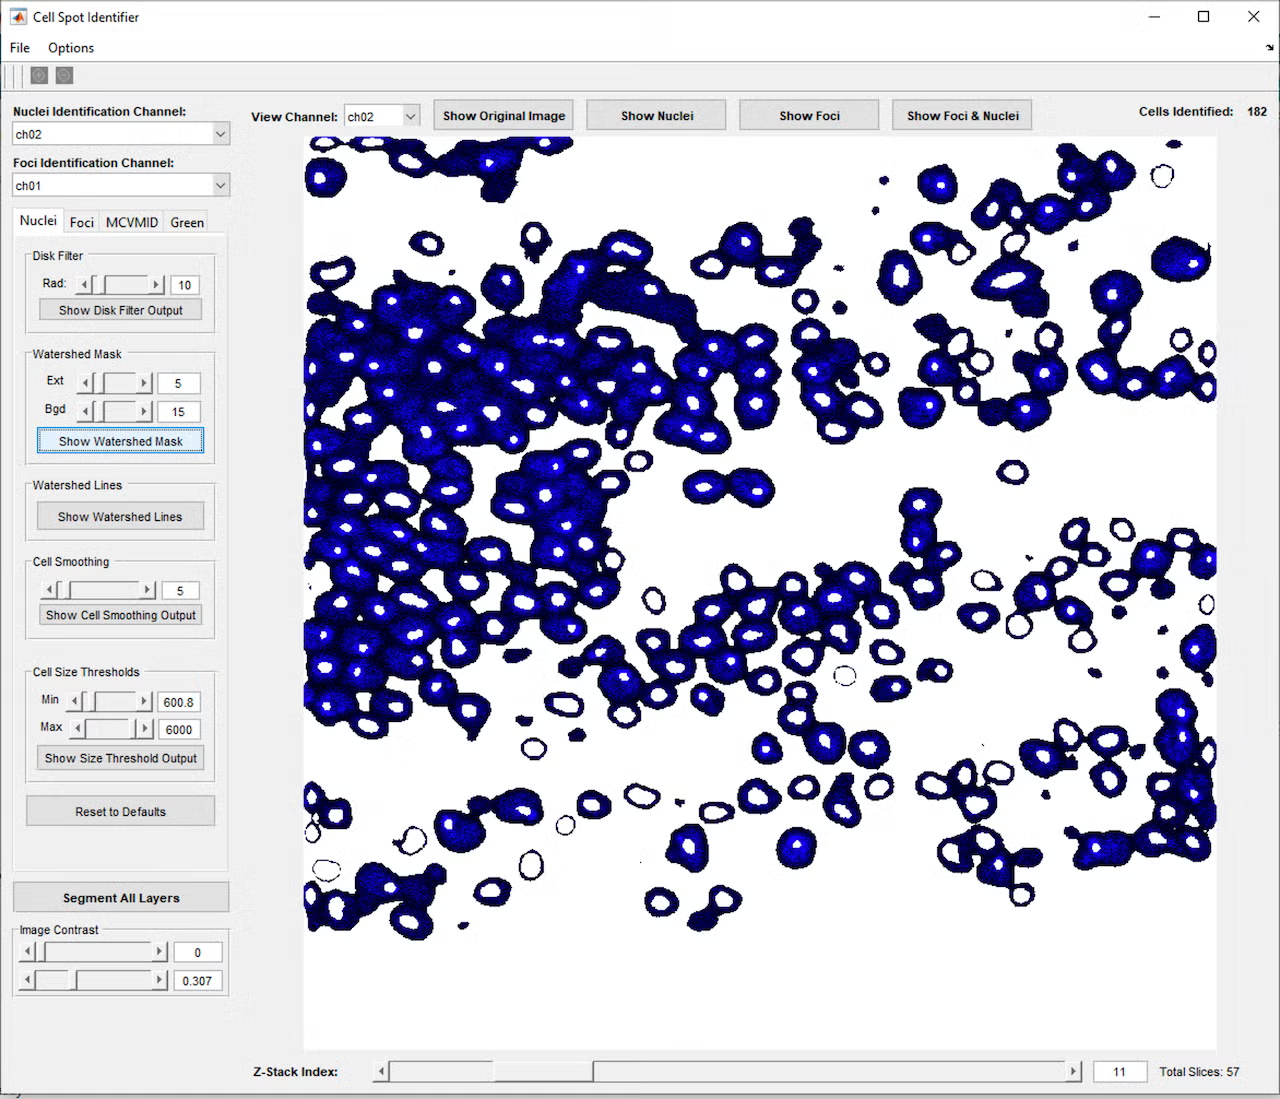
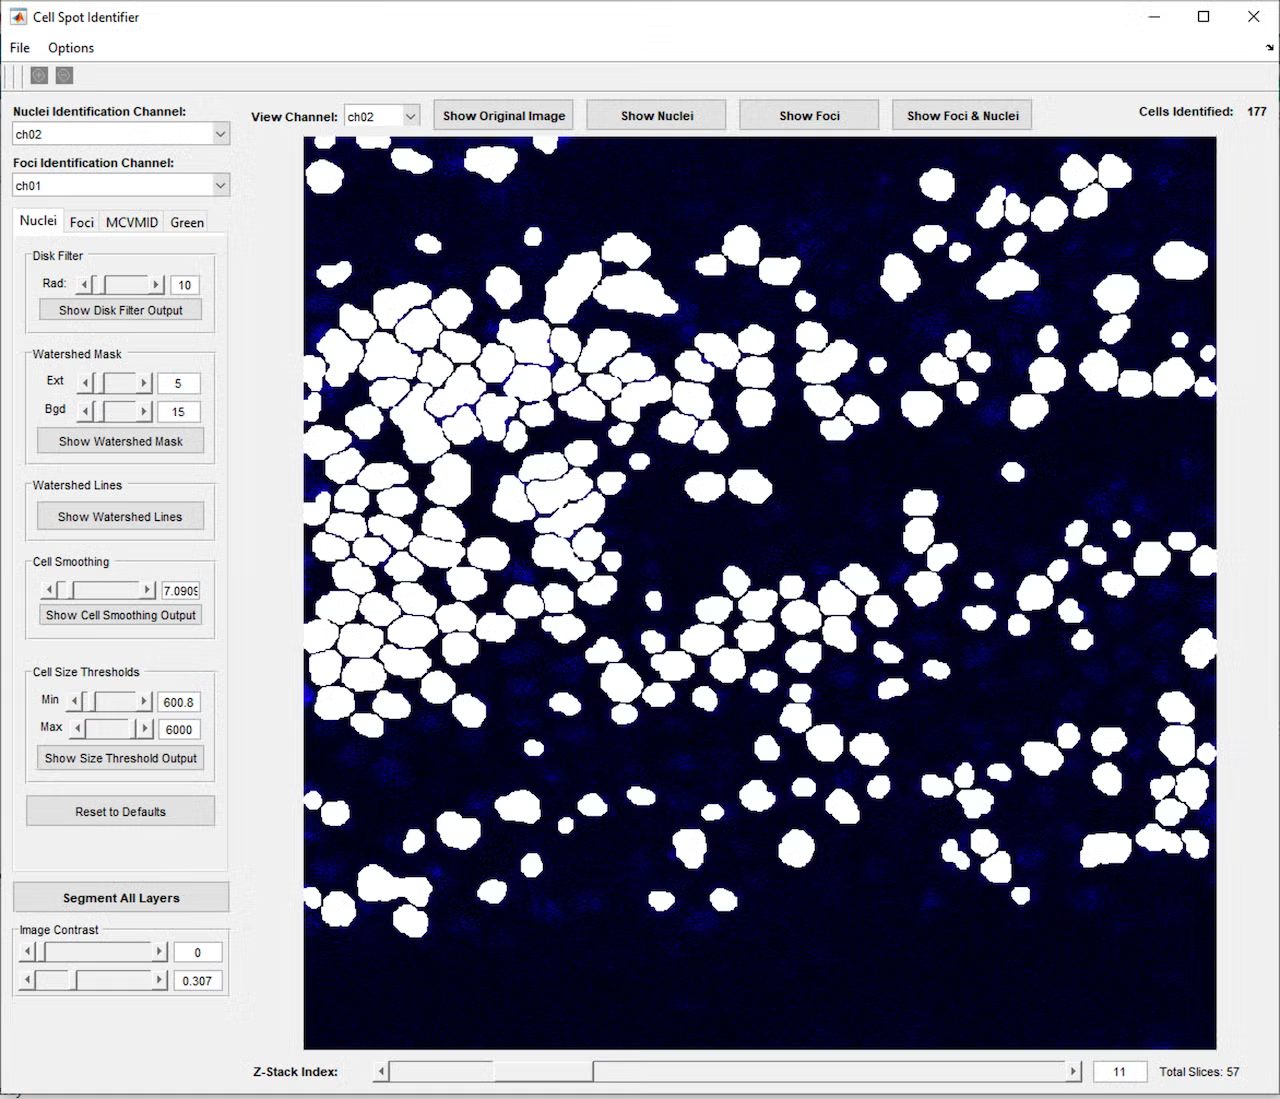
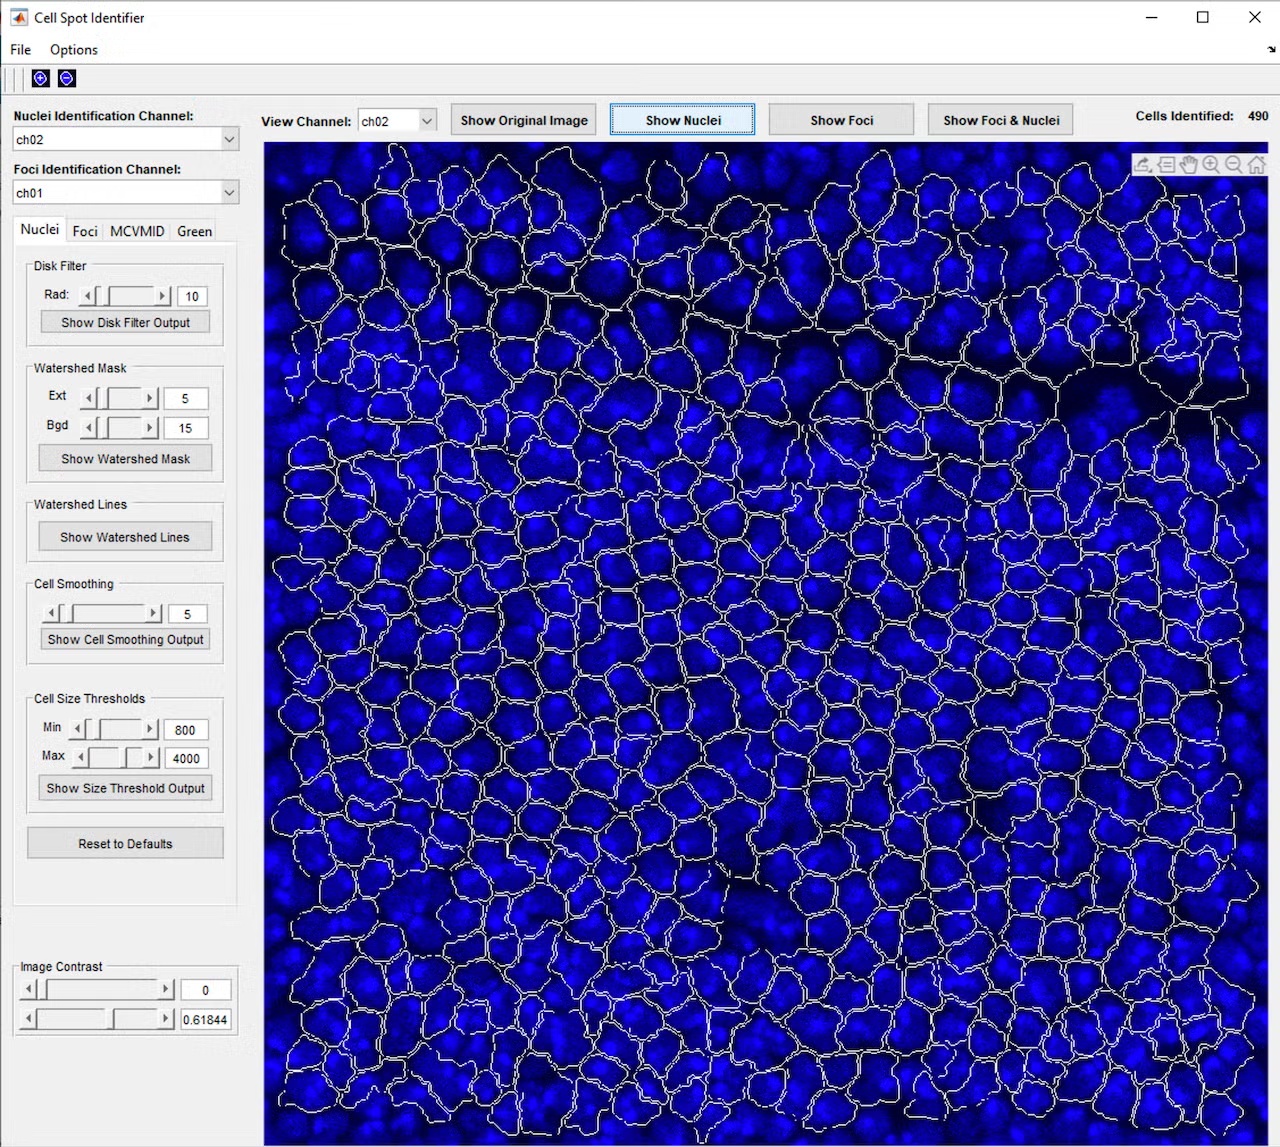
This project began with a request to simply identify all the cells in a microscope fluorescence image, and through close collaboration and many test and feedback iterations with the lab, developed into a much more complex program. The program provides a graphical interface in MATLAB that allows the user to open a single image or z-stack of images (a series of images at the same location with the microscope focused to different depths). Initial testing showed that cells and nuclei were not always identified consistently, depending on the brightness and blurriness of the image, so a second iteration added controls to fine-tune the image processing parameters used to identify the cells and nuclei, including selection of which color channel would be used in the identification process. This allowed identifying the cells using one color channel (blue, for example), while carrying these cell area definitions over to the remaining red and green channels, which contained markers of interest for analysis.
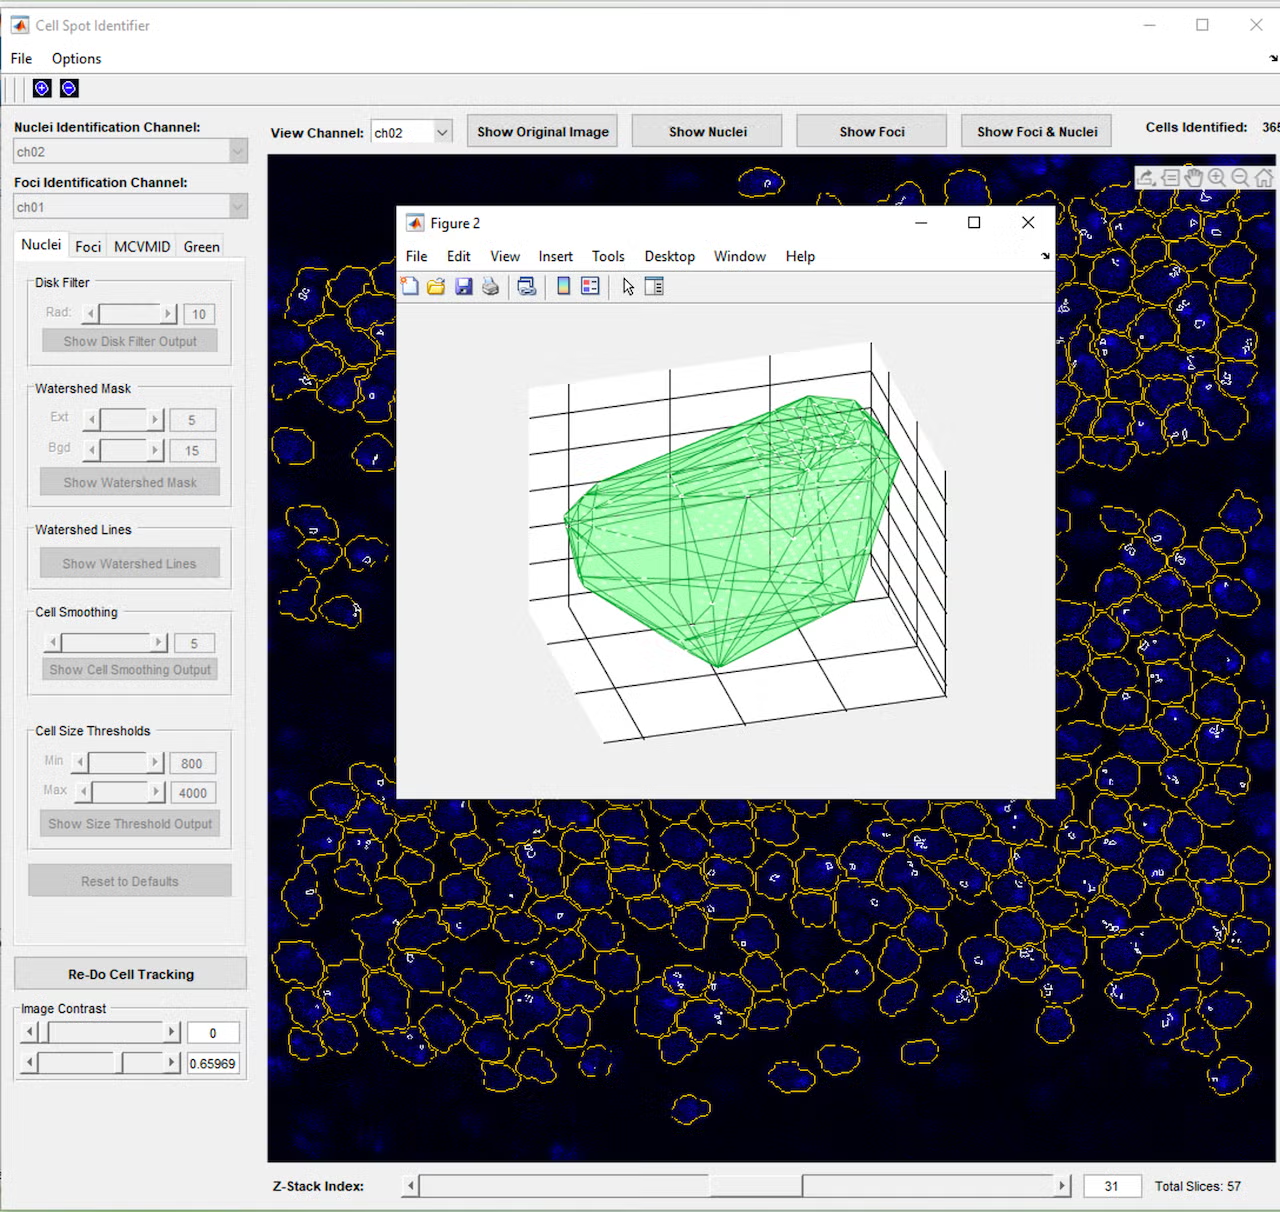
However, even with the tunable parameters, cells would occasionally be missed or identified incorrectly, so a further iteration added controls to manually add, adjust, or remove cells from the set of cell identifications. Once cells and nuclei could be reliably identified, a button to join cells across the layers of the z-stack was added, so a cell could be tracked through the 3D layers of space, essentially allowing a full 3D reconstruction of each cell. Based on feedback that it was difficult to visualize these 3D reconstructions, a function was added to allow the user to click a cell to open a 3D model of the cell’s points across the layers and check the cell’s 3D shape and characteristics such as volume and brightness.
Once cell identification and tracking across 3D frames could be reliably completed, analysis functionality was added. We worked with the lab to learn what information they needed and to iterate through a variety of calculation methods to determine what best quantified the results they were looking for. These results are exported to an Excel file with various calculations including cell areas and color channel intensities in separate tabs, as well as a tab recording the parameters that were used in the analysis, so it can be reliably repeated at a later time.